Disclaimer: This post may contain affiliate links. If you make a purchase through them, we may earn a commission at no extra cost to you.
Your Performance Max campaign shows a great ROAS, so the account must be healthy, right? Not necessarily. A campaign is an average of hundreds or thousands of products, and the average hides the products that burn your budget.
In this guide, you’ll learn what a product-level Google Ads audit is, what to check, and how to run one in two ways: manually in Google Ads, and automatically with a free tool. Every step comes with screenshots.
See which products lose money, eat most of your budget or never get a click. Product Analytics by Dotidot pairs your Google Ads data with your Merchant Center feed and sums up what it finds in plain language with AI.
Free, read-only, no credit card needed.
What is a product-level Google Ads audit?
A product-level audit reviews performance for each product in your feed, not for each campaign, asset group or ad group. For every product, you look at cost, conversion value, ROAS, clicks and impressions.
A standard Google Ads audit covers account structure, campaign settings, keywords and negative keywords, bid strategies, ad copy, landing pages and conversion tracking. All of that matters. But in Performance Max and Standard Shopping, your products are what spends the money. An audit that stops at the campaign level only shows half the picture.
Why product-level audits get missed in Google Ads audits
I’ve audited ecommerce accounts many times: campaign, ad group, keyword, bid. The products usually got skipped. I’m not the only one. Here’s why it happens:
- Audit checklists grew up on search campaigns. The top-ranking Google Ads audit guides walk you through keywords, broad match, the search terms report, quality score, smart bidding, location targeting and landing pages. Products rarely get their own step.
- Campaign metrics look fine. A healthy ROAS or CPA at campaign level gives you no reason to dig deeper.
- Product data lives somewhere else. Product metrics sit in the separate Products tab, and Google says their totals won’t match your campaign reports. That makes them easy to distrust or ignore.
- Performance Max data was incomplete. Until June 2026, Google only reported product cost and conversions for Performance Max on Search. Metrics for all Performance Max networks are new.
- Big catalogs take hours. With a few thousand products in a feed, the analysis meant hours in a spreadsheet, so it was the first thing to drop.
Why audit your Google Ads products?
Skipping products is a problem, because good products mask bad ones, and that’s where wasted spend hides.
Here’s an example. A campaign shows a 600% ROAS. Break it down by product, and you find that 20% of spend goes to products at 2000% ROAS, while 80% of spend goes to products at only 250% ROAS. The campaign average looks great, but most of the budget performs far below it.
How common is this? Dotidot analyzed data from 88 ecommerce brands across Google Ads and Meta in the EU and US (Q4 2025 to Q1 2026). According to their analysis:
- 48.4% of ad spend went, on average, to products with below-threshold ROAS. The worst account was at 95.9%.
- Only 21.6% of promoted products received meaningful traffic.
- Every industry was affected. Electronics & Tech was the worst at 61.4% of spend on low-ROAS products, and Sports & Leisure the best at 35.1%.
These are a vendor’s numbers from its own users’ data, so treat them as a benchmark rather than a rule. Still, they’re a good reason to look one level deeper. Every product that burns money lowers the ROI of your whole Google Ads budget.
Your product-level audit checklist
Work through these five questions:
- Spend concentration: What share of your products takes most of your budget? If a handful of products eat the spend, the rest of the catalog never gets tested.
- Loss-making products: Which products have ROAS below 100%, meaning their revenue doesn’t even cover their ad cost?
- Underperformers: Which products have enough data to judge, but perform below your account average?
- Catalog coverage: How many products in your feed get no clicks, or no spend at all?
- Categories and brands: Which categories and brands earn their budget, and which only spend it?
Two more checks come straight from Google’s product reporting guidance:
- Product overlap: Is the same product running in multiple campaigns?
- Eligibility: Have any of your top products moved to Not eligible?
⚠️ Note: Don’t judge a product on too few clicks. At a 1.5% conversion rate, an average product gets fewer than one conversion in 30 clicks, so no sale yet doesn’t mean a bad product. Use a simple rule of thumb: click threshold = 3 ÷ your account’s conversion rate. At a 1.5% CVR, that’s 200 clicks, where an average product would have about 3 conversions. Only then call a product a loser.
How often should you audit your Google Ads account?
I run a product-level audit once a month. That’s often enough to catch products that start burning budget, and long enough for each product to collect meaningful data.
After structural changes, audit more often. If you split campaigns, added custom labels or moved products between campaigns, check a shorter time period to see whether the changes show up in performance and work as intended. Compare that period with the one before the change, so you know what actually moved.
How to perform a Google Ads audit at product level in the Products tab
⏱️ Want to skip the manual analysis and save time? Jump to the free tool that builds your product-level audit in a few minutes.
Google Ads has product reporting built in. It’s free, and it’s the right place to start before you optimize anything.
Step 1: Open the Products tab
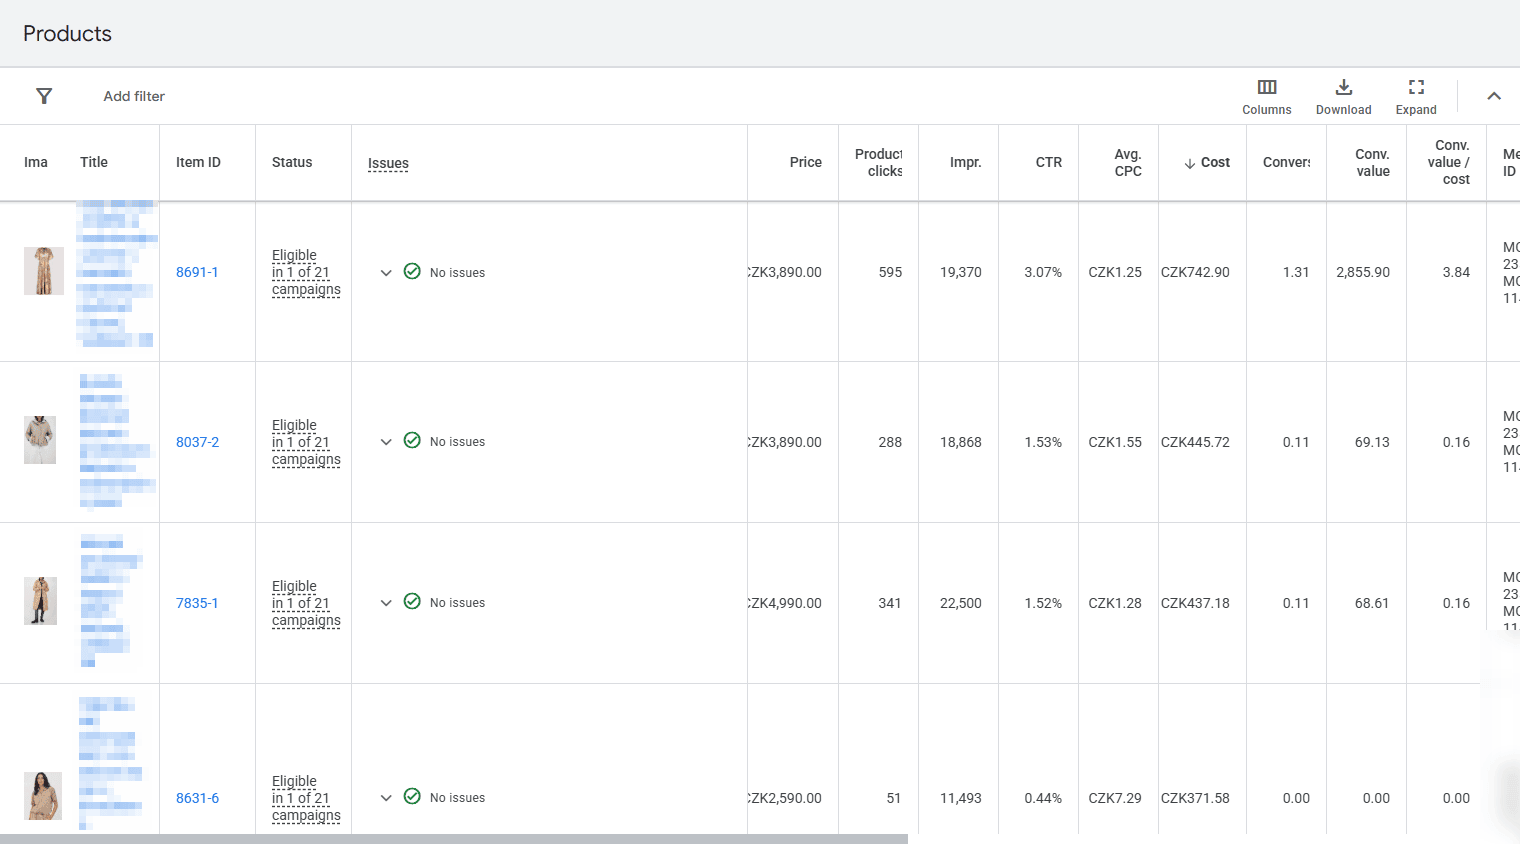
Go to Campaigns > Products. At the account level, you’ll see products from Standard Shopping and Performance Max campaigns. To see a single campaign, use the Campaigns filter.
Since June 2026, Google reports product metrics across all networks in Performance Max, plus Video, App and Demand Gen campaigns. Before that, cost and conversions only covered Performance Max on Search and Standard Shopping. Expect a one-time jump in impressions and clicks for Performance Max when you compare against older periods.
Step 2: Add the columns you need
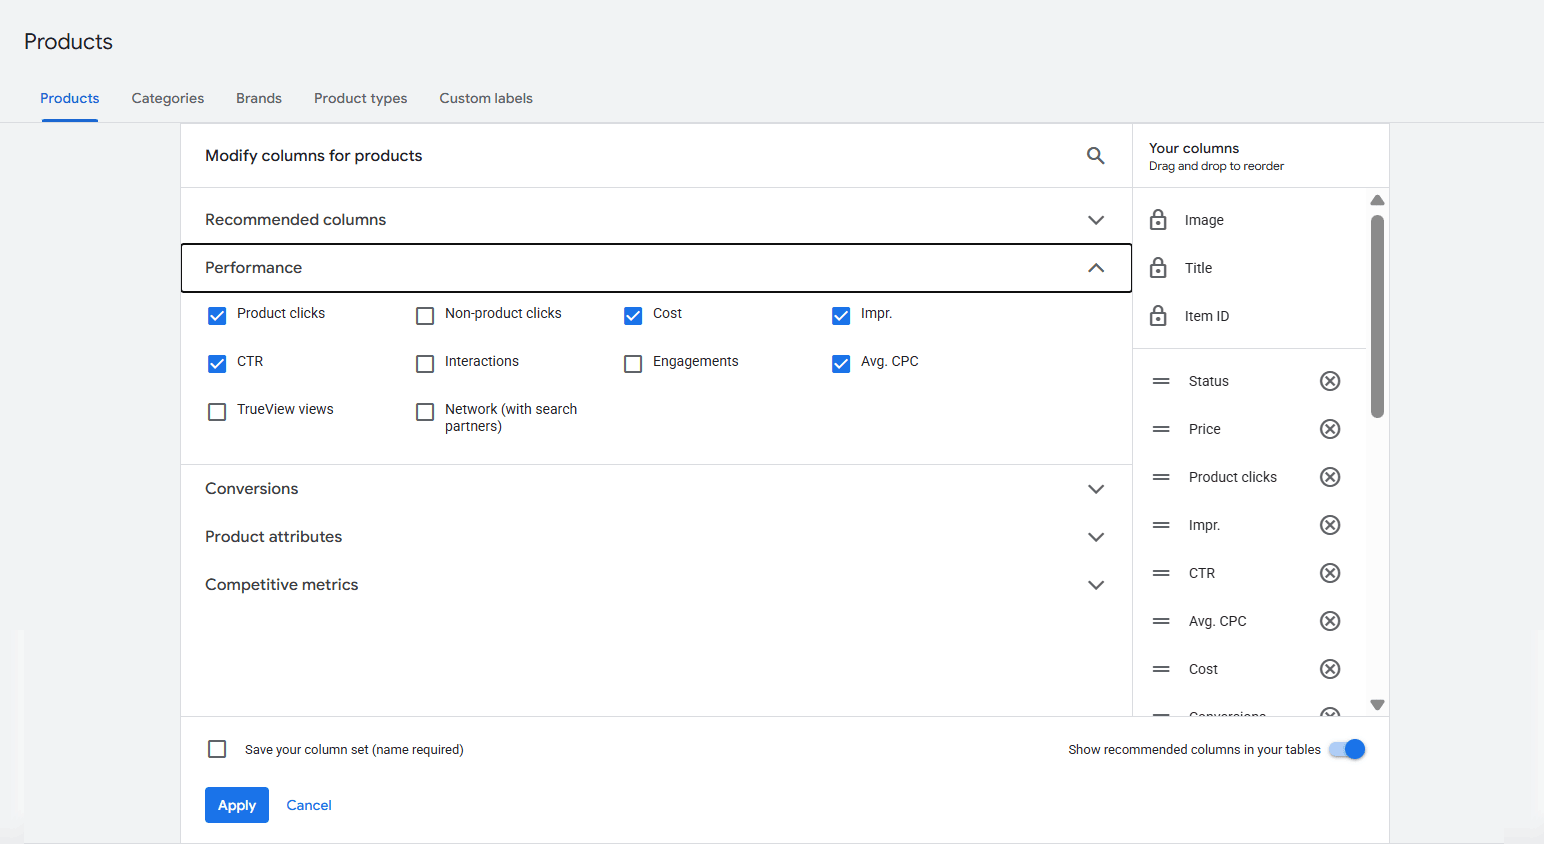
Add cost, conversions, conversion value, conv. value / cost (ROAS), avg. CPC, product clicks and impressions. Then add the attributes you want to group by: brand, category, product type or custom label.
⚠️ Note: Since the June 2026 update, the old Clicks column is called Product clicks. It only counts clicks on a specific product. Clicks on a headline or your store name are counted separately as Non-product clicks.
Step 3: Sort and filter
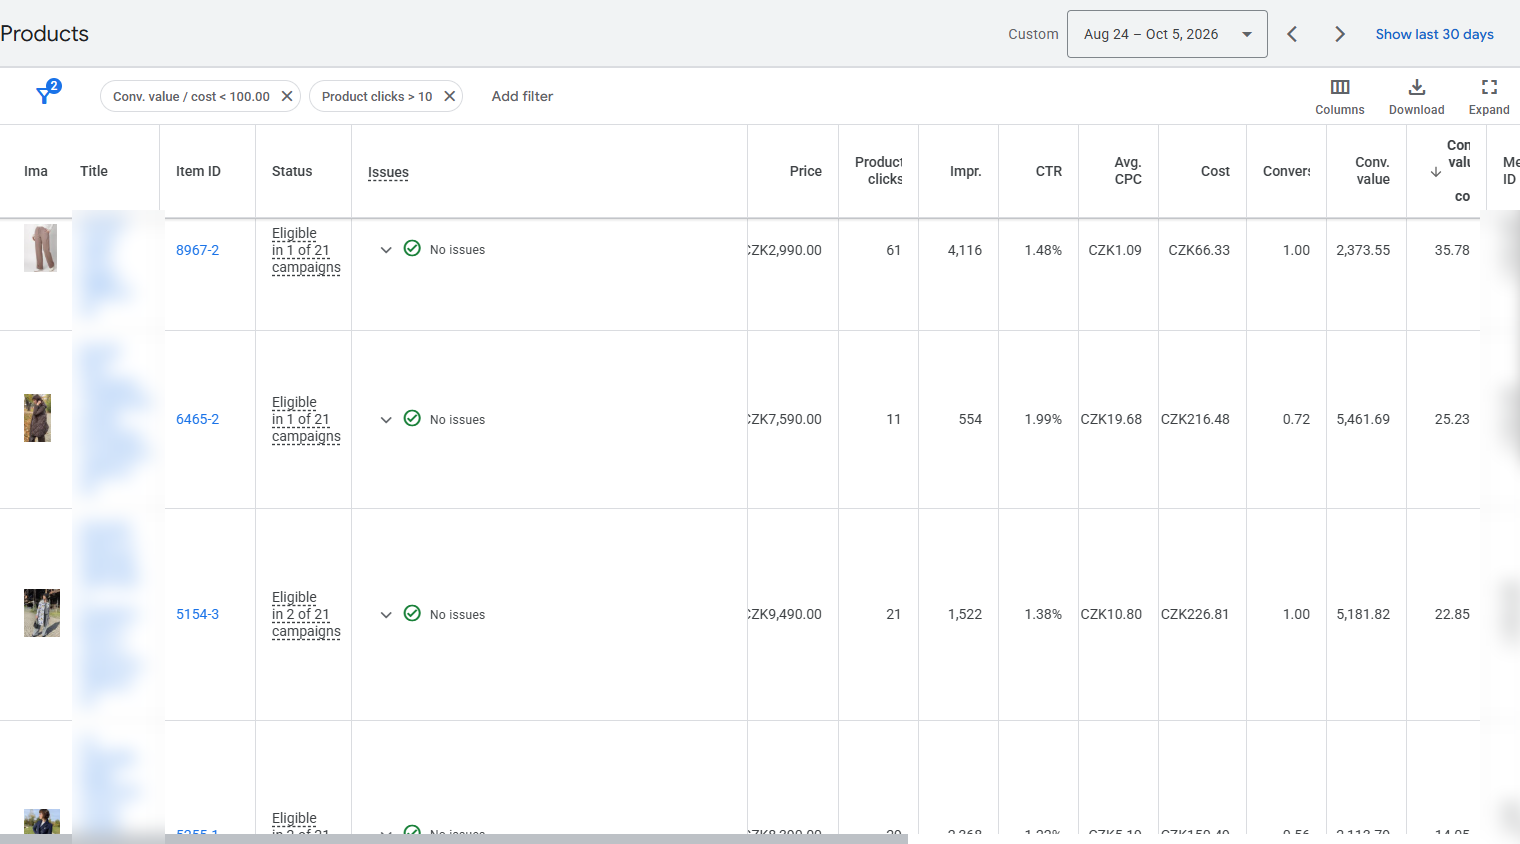
- Sort by cost to check spend concentration.
- Filter by conv. value / cost below 100% with enough product clicks to find loss-making products.
- Sort by conversion value to find your top revenue products.
- Check the Status column for top products that moved to Not eligible.
Step 4: Check for product overlap
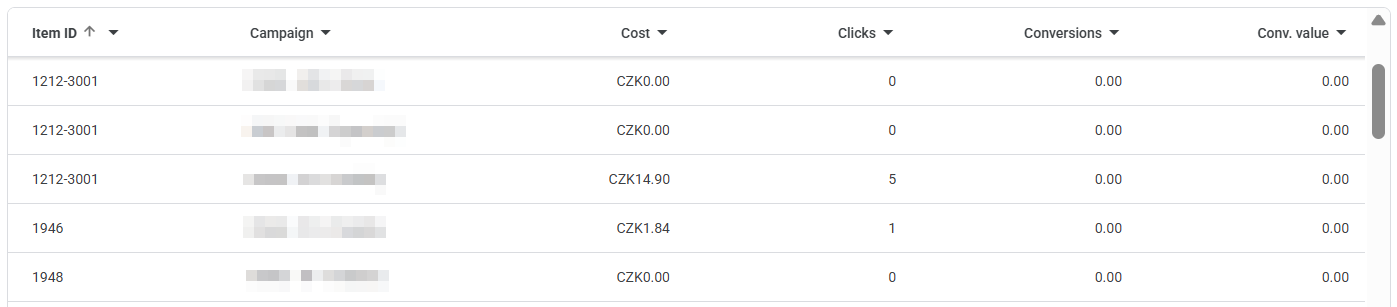
Go to Insights and reports > Report editor, open Predefined reports, then select Shopping > Item ID. Add the Campaign column and sort Item ID A to Z. Products listed under more than one campaign are overlapping.
Step 5: Export and count what’s missing
The Products tab shows products that have data. To find products with no clicks or no spend, download the report and compare it with your full product count in Merchant Center.
⚠️ Note: Product totals won’t match campaign totals. Google says this is expected. Product-level cost and conversions only include the share tied to ads that served your feed products. Impressions can be higher, because an ad showing five products counts five product impressions.
Where the manual audit gets hard
The native reports give you the data. The work is everything around it:
- No ready-made segments: you build each filter (losers, underperformers, spend concentration) yourself.
- Your thresholds, recalculated every time: the account-average ROAS changes with every date range.
- Coverage takes a spreadsheet: counting inactive products means matching your export against the feed.
- Big catalogs slow everything down: with thousands of products, this quickly turns into a half-day job.
So how do you do the same audit in minutes? With a tool.
How to run a free Google Ads audit with Product Analytics by Dotidot
Product Analytics by Dotidot pairs your Google Ads data with your product feed and builds the segments for you. It’s free, needs no credit card, and access is read-only.
In the app’s words: “We never modify or share your data, they’re read-only and fully secured.” Dotidot’s FAQ adds that your data isn’t used to train AI and is processed in the EU under GDPR.
Want to know more before connecting anything? Check the Product Analytics page for how it works and the FAQ.
Step 1: Open the tool and sign in
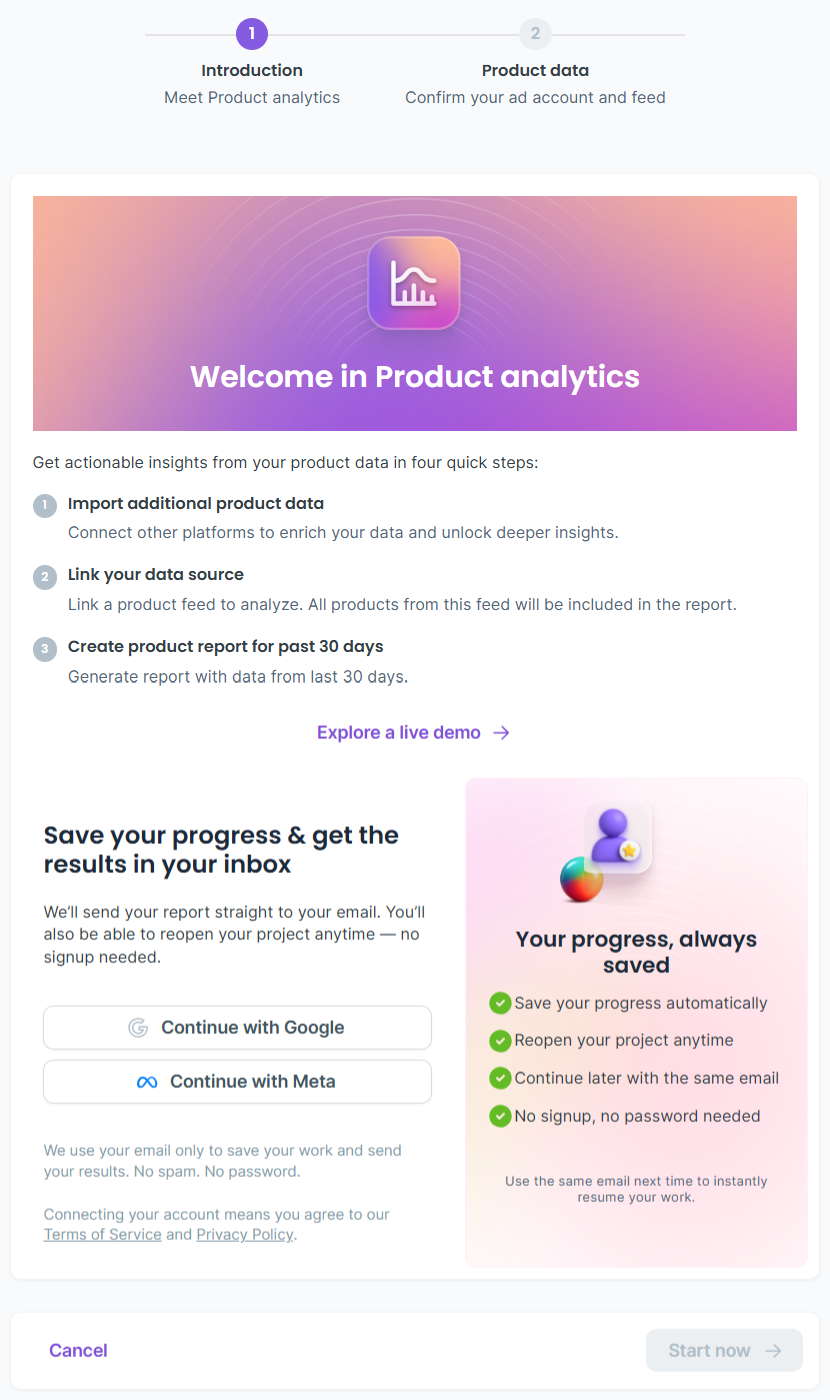
Go to Product Analytics by Dotidot and select Analyse PMax and Shopping. In the tool, select Start now and sign in with Google. There is no password: your email only saves your progress and sends you the report.
Step 2: Confirm your ad account and feed
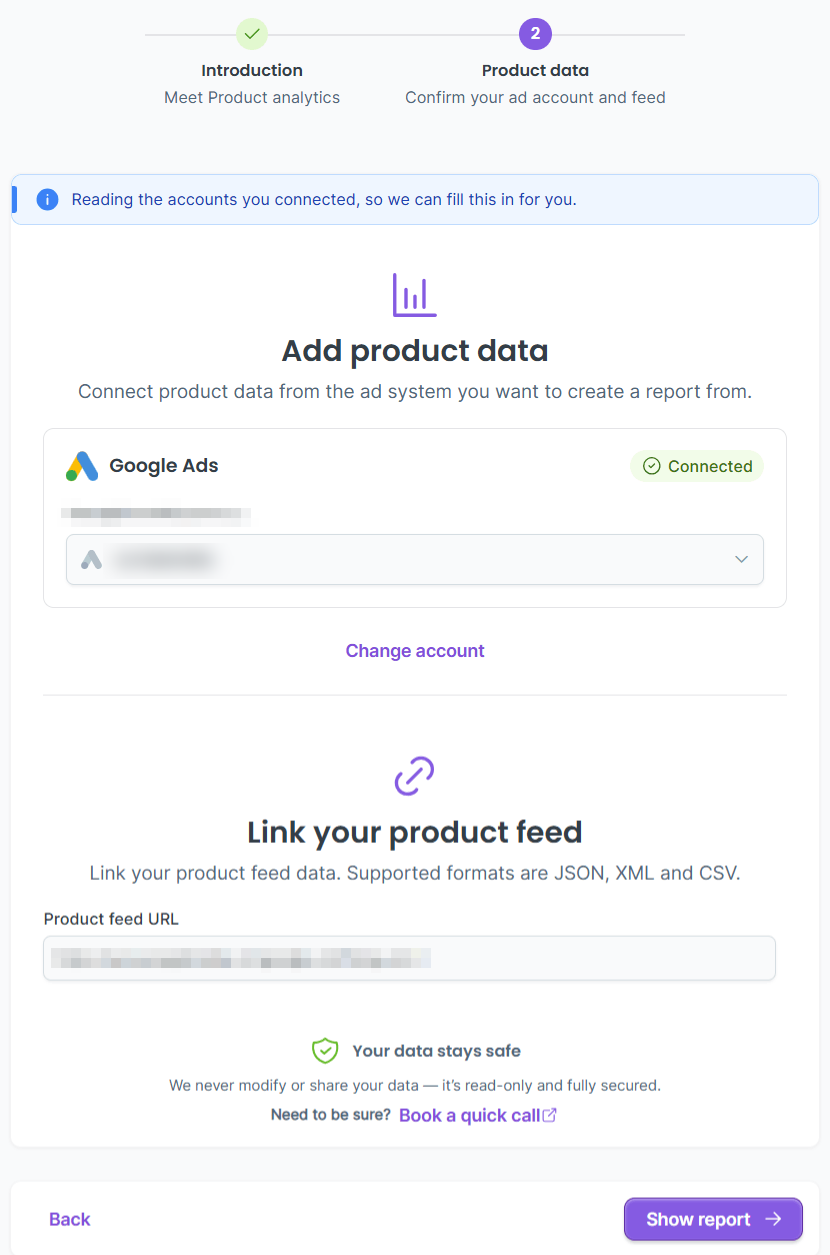
Product Analytics reads the accounts you connected and fills this step in for you. It pre-selects your Google Ads account and your product feed URL, so there is nothing to look up. Check both and select Show report.
⚠️ Note: Use Change account to pick a different Google Ads account. If the feed field stays empty, paste the URL yourself. Supported formats are JSON, XML and CSV.
Step 3: Wait for the report
The report covers the last 30 days by default. Dotidot says the setup takes 2 minutes, but generating the report takes a little longer. The app itself says “This usually takes 2–5 minutes.” When I connected one of my client accounts, it imported 3,339 products and loaded 62,595 daily stats in a few minutes.

📱 Running Meta Advantage+ catalog ads too? Product Analytics by Dotidot can run the same product-level analysis for your Meta account. Select Analyse Meta Advantage+ instead.
How to read the report
Product segments
The tabs split your catalog into the segments from your audit checklist. Click one and the whole dashboard filters to those products.
| Segment | Default filter | Audit question it answers |
| Losers | ROAS < 100%, clicks > 10 | Which products lose money? |
| Underperformers | ROAS below account average, clicks > 10 | Which tested products fall short? |
| Budget spenders | Products consuming 10% of spend | How concentrated is spend? |
| Active products | Clicks > 10 | How much of the catalog works? |
| Inactive products | No spend | What does Google ignore? |
The default threshold is low for calling a product a loser (see the rule of thumb above). Dotidot says you can set custom thresholds to match your account.

Performance over time and insight cards
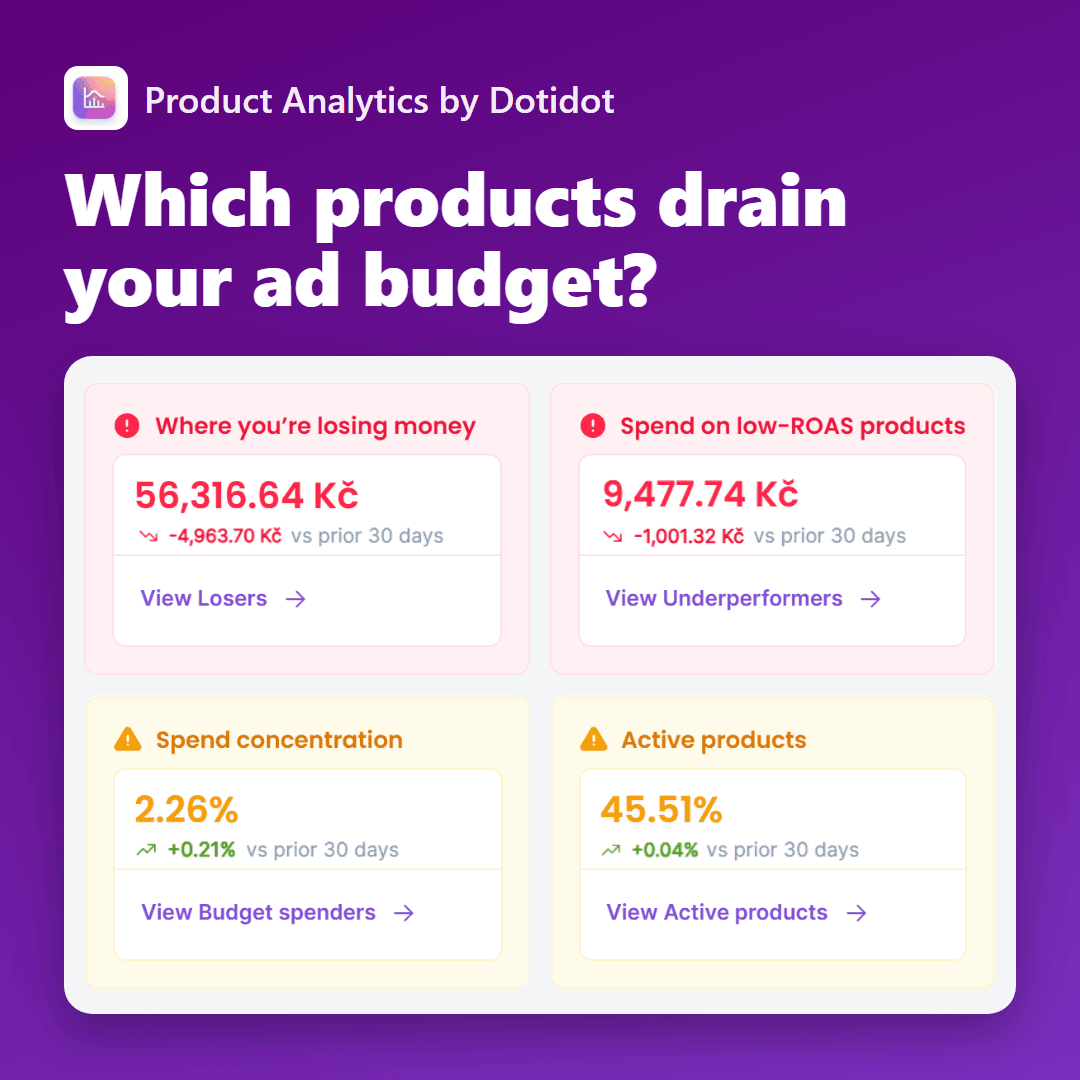
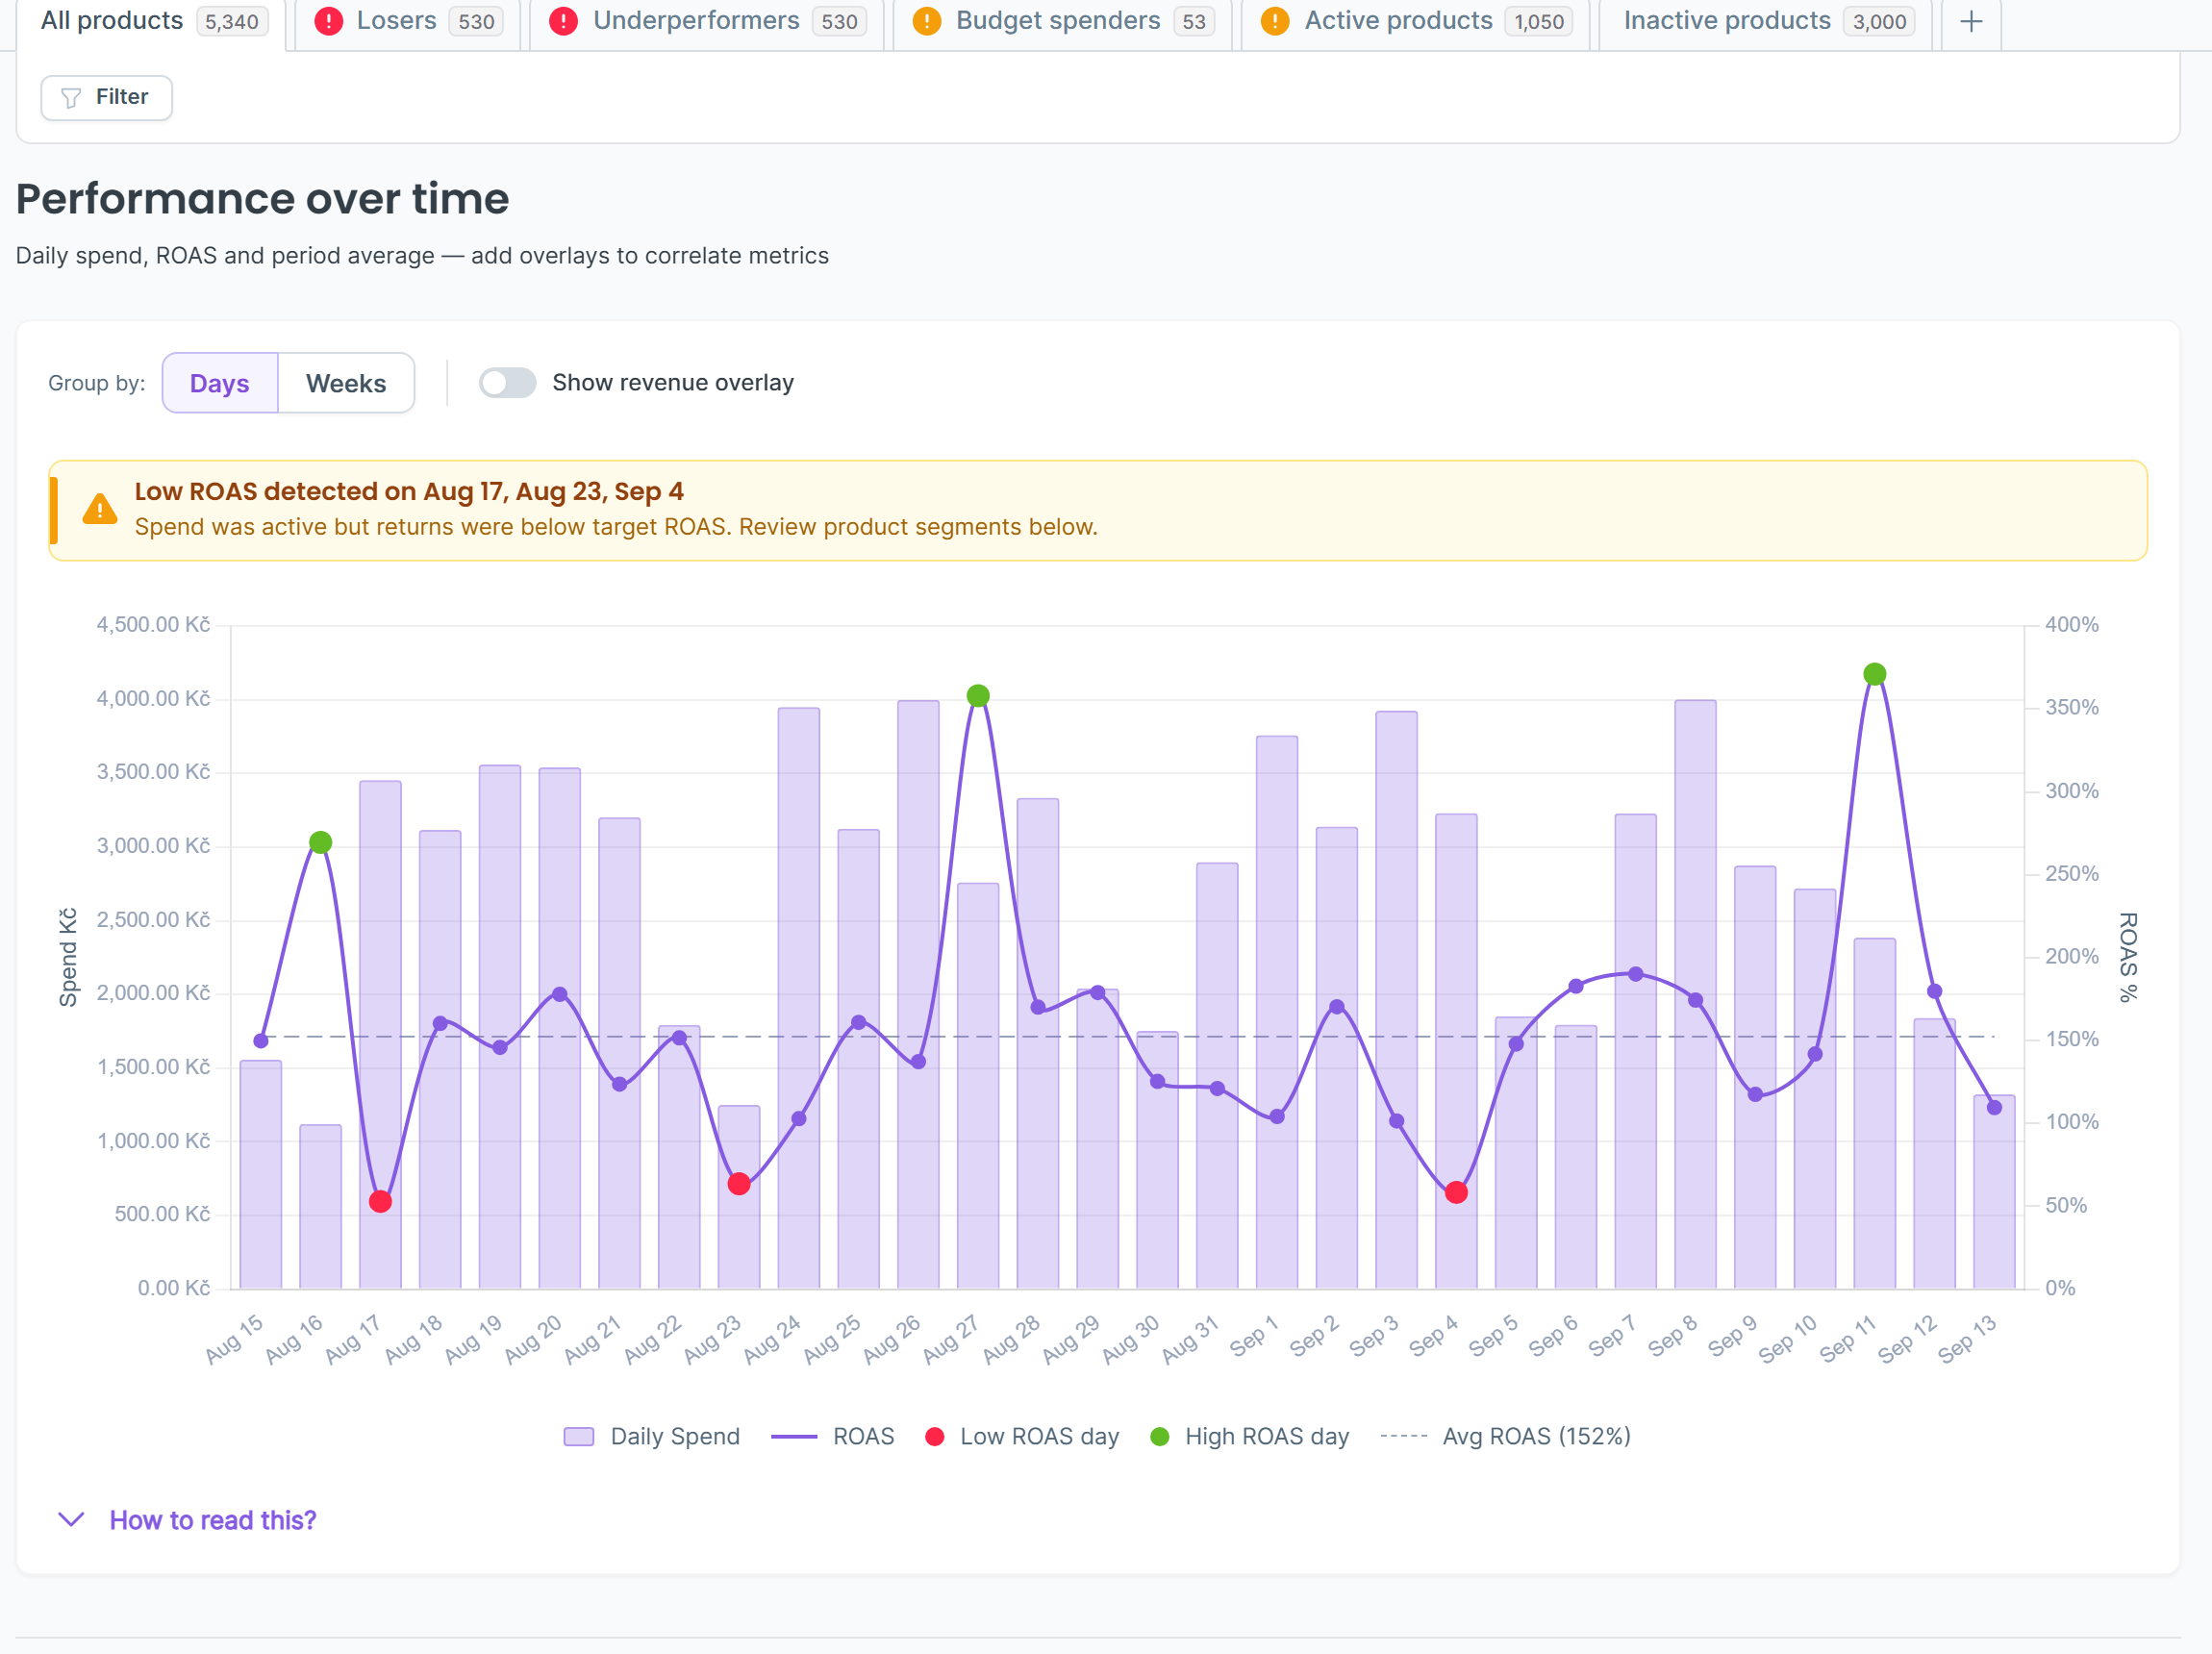
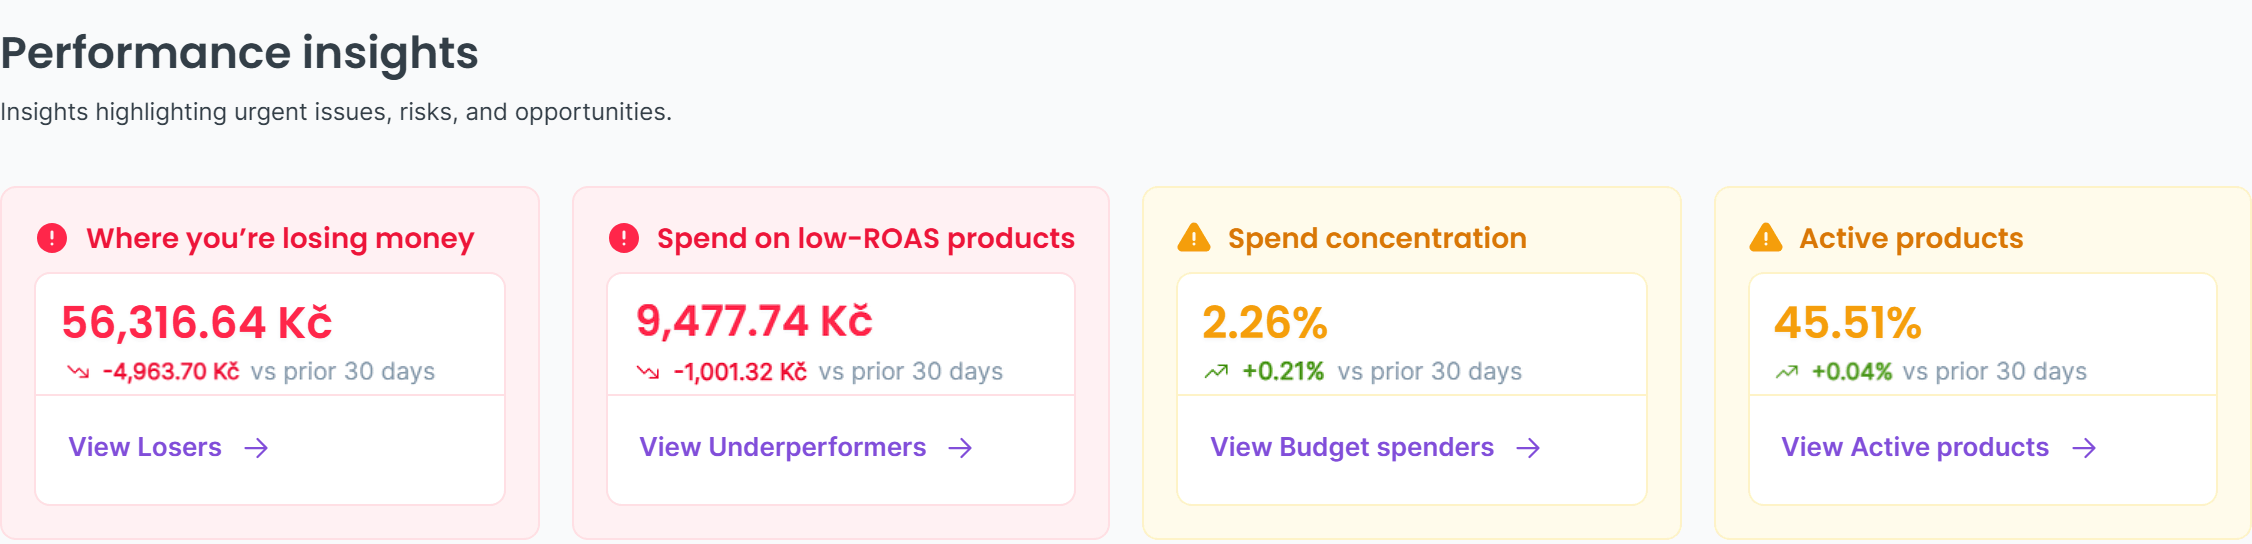
The chart shows daily spend, ROAS and your average ROAS, and flags low-ROAS days. Below it, four cards sum up the audit: Where you’re losing money, Spend on low-ROAS products, Spend concentration and Active products.
Categories and product table
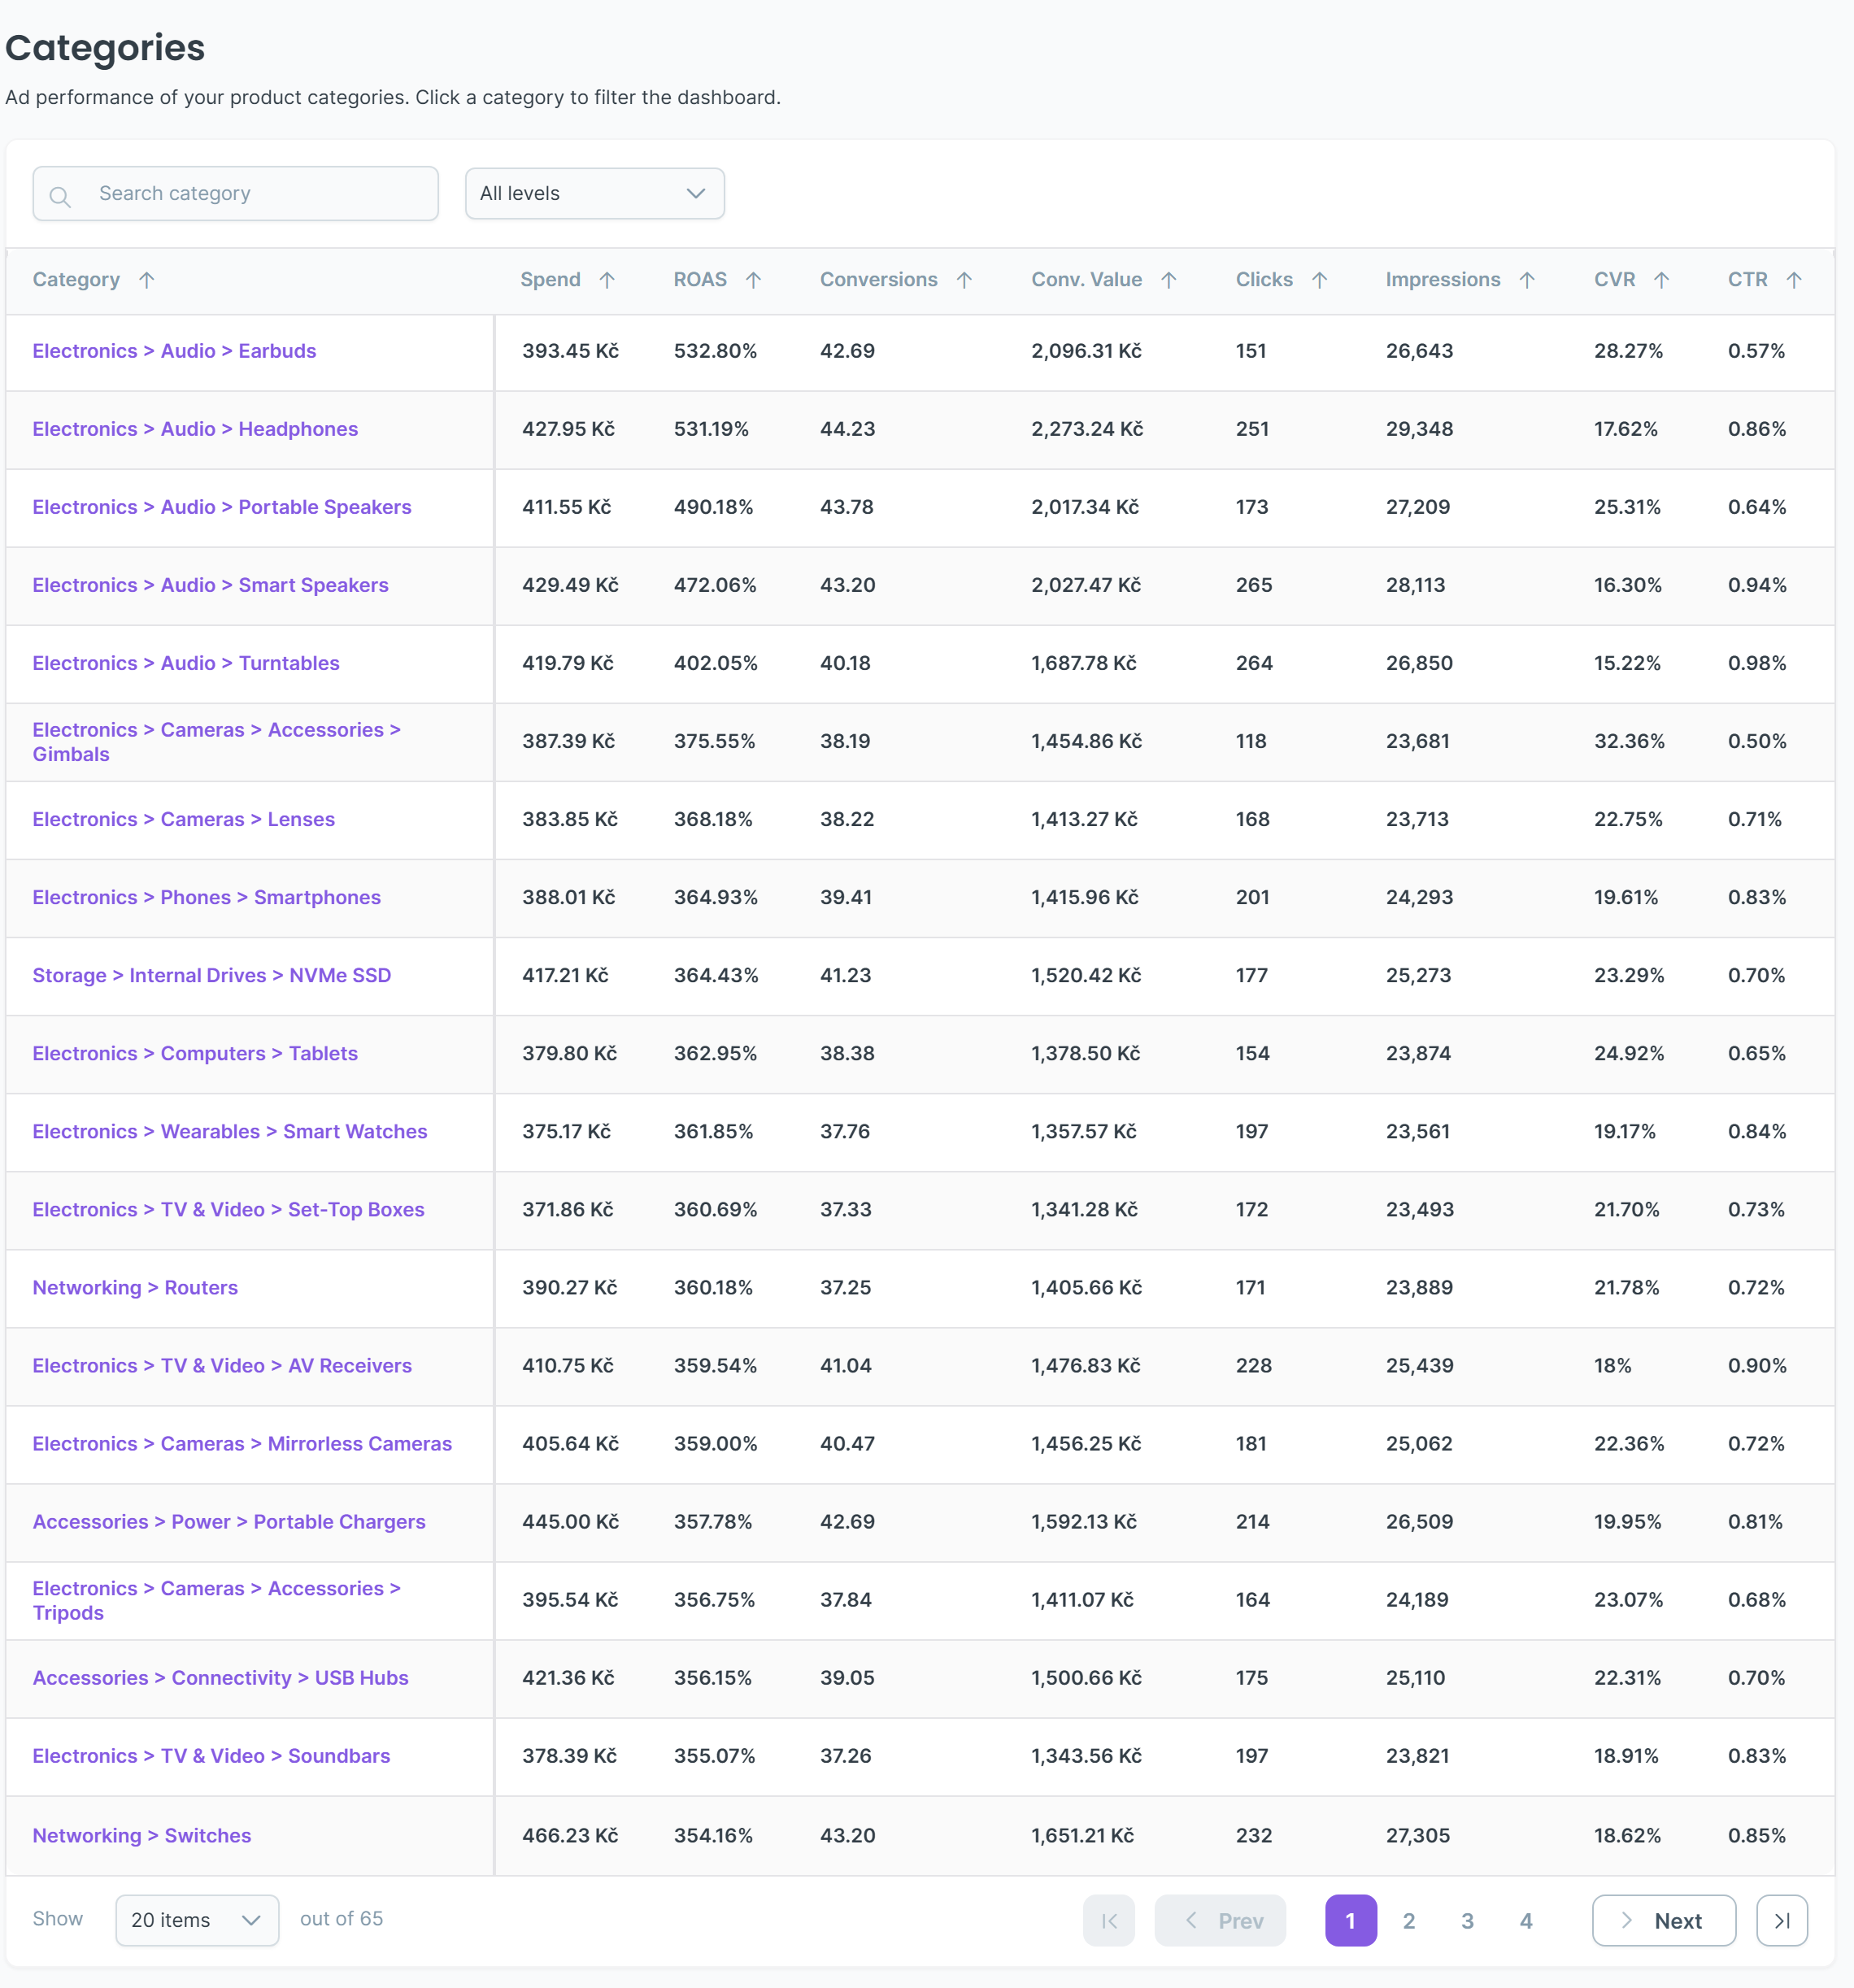
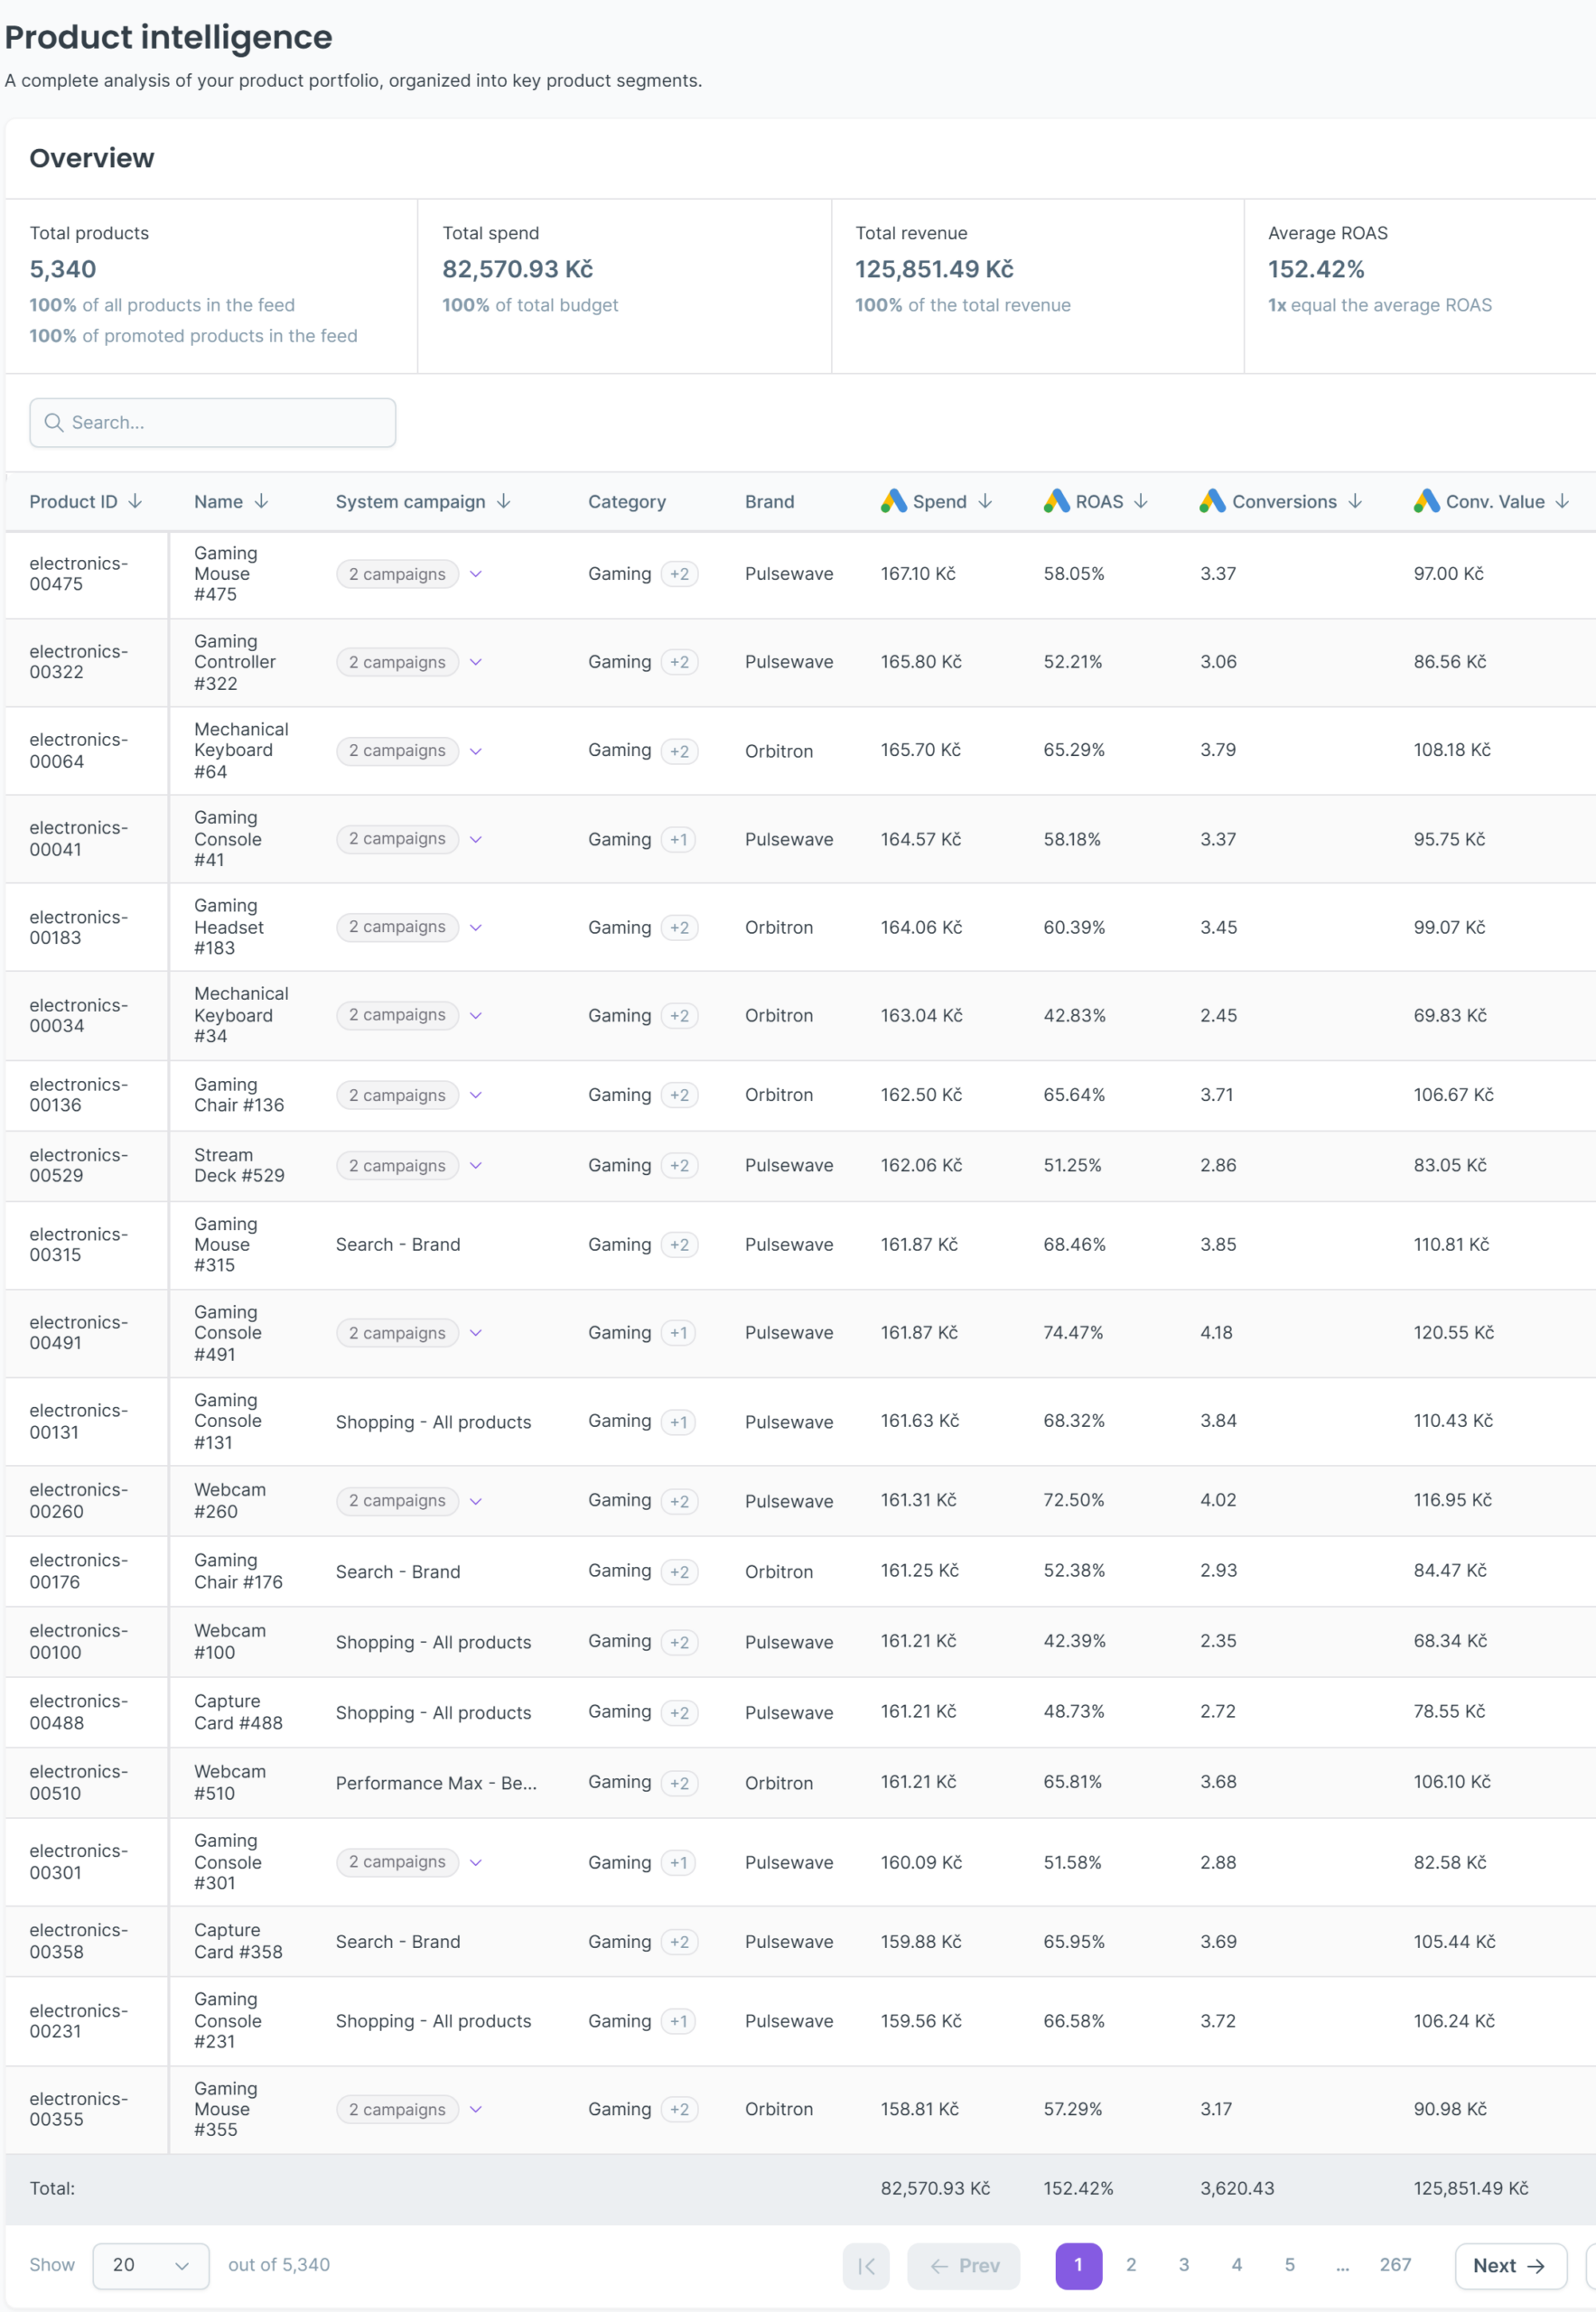
Categories ranks your category tree (levels 1 to 5) by spend, ROAS, conversions, CVR and CTR. The product table lists every product with its campaign, category, brand and metrics. It also shows Campaign moves and Avg. days in campaign, and flags products running in more than one campaign, which covers the overlap check.
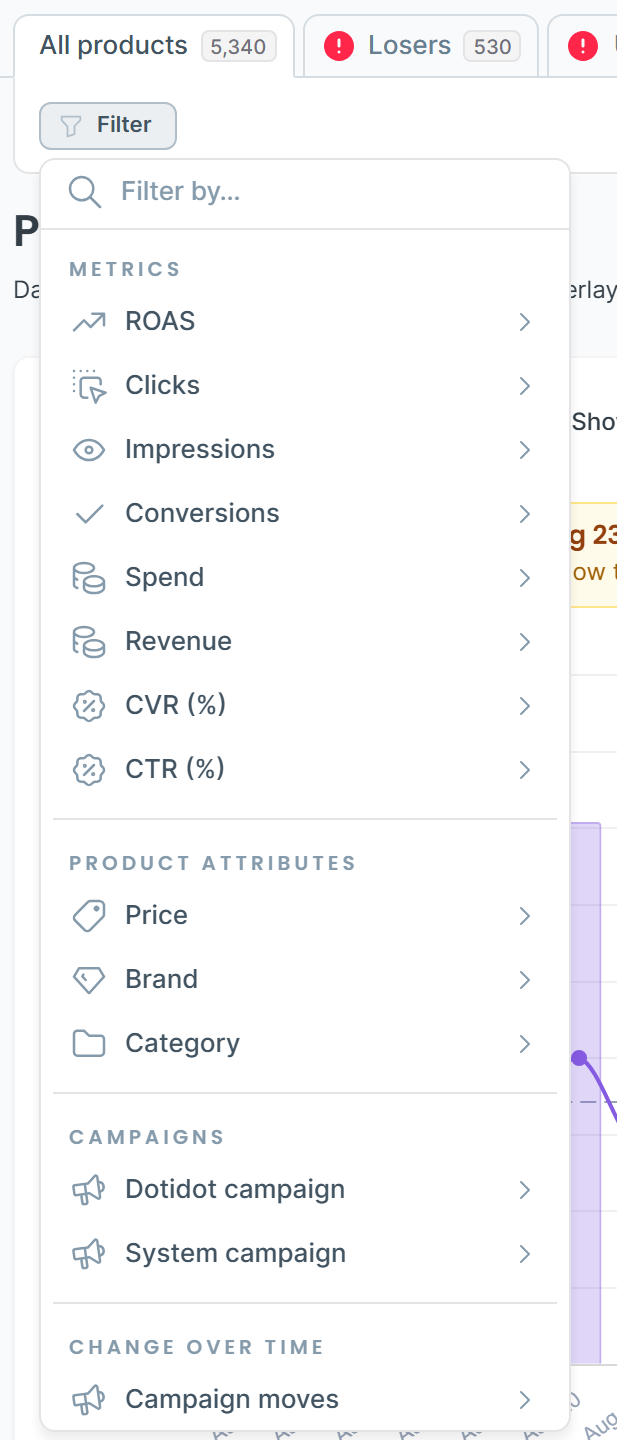
The Filter menu cuts the table three ways: by metrics (ROAS, clicks, impressions, conversions, spend, revenue, CVR, CTR), by product attributes (price, brand, category) and by change over time (revenue trend, clicks change, spend change, campaign moves, avg. days in campaign). Turn on Compare to see changes against the previous period.
AI Insights
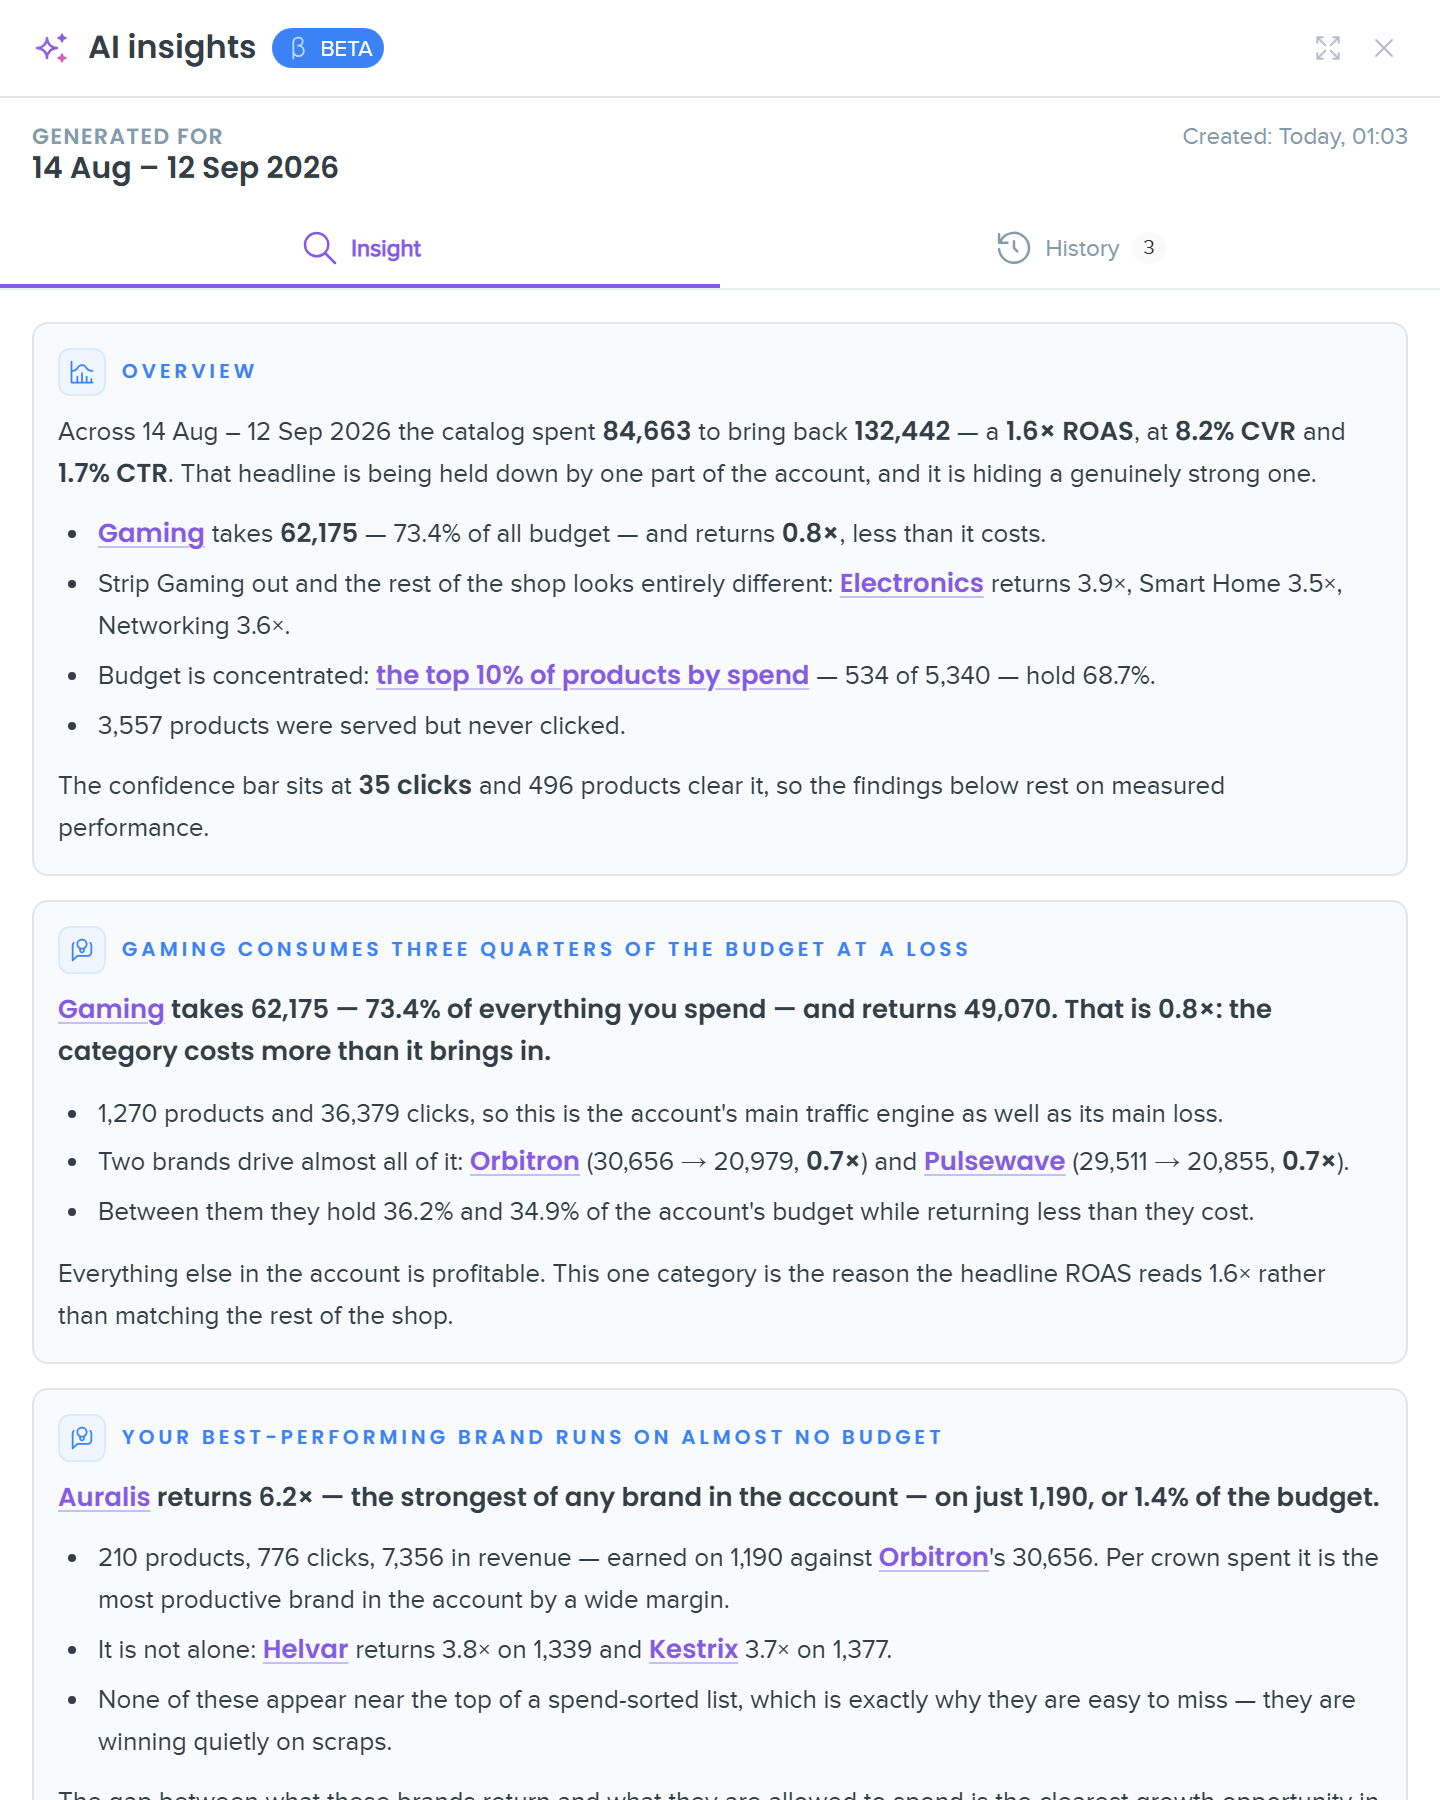
AI Insights (currently in BETA) turns the report into a written summary with concrete numbers: an overview, headline findings (for example, a brand with a high ROAS running on almost no budget), catalog visibility, and next steps ordered by the money at stake. Brand and category names in the text link straight to the matching products.
What to know before you rely on it
- Free plan limits: up to 100K products per report and a 365-day data range.
- Platforms: Google Performance Max and Shopping, plus Meta Advantage+.
- AI Insights is in BETA: check the findings against the product table before you act on them.
- Coming next, according to Dotidot: email alerts when spend or revenue changes, actions straight from the insights, and a Dotidot MCP for asking about your product data in an AI assistant.
Google Ads Products tab vs. Product Analytics by Dotidot
| Google Ads Products tab | Product Analytics by Dotidot | |
| Price | Free | Free |
| Access | Built in | Read-only connection |
| Loser and underperformer segments | Build your own filters | Ready-made |
| Spend concentration | Sort and calculate | Ready-made |
| Inactive products | Export and compare with Merchant Center | Ready-made |
| Product eligibility and issues | Yes | Not covered |
| Written summary | No | AI Insights (BETA) |
| Platforms | Google Ads | Google Ads and Meta |
The native reports are the source of truth for eligibility and Merchant Center issues. The tool saves you the spreadsheet work on segments and coverage. Most accounts benefit from both.
See which products lose money, eat most of your budget or never get a click. Product Analytics by Dotidot pairs your Google Ads data with your Merchant Center feed and sums up what it finds in plain language with AI.
Free, read-only, no credit card needed.
Run your first product-level audit
Before you put more money into your Google Ads budget, check your budget allocation and find out which products it would go to. A campaign-level PPC audit won’t show you that. Start with the Products tab in Google Ads, or get the full product-level audit in a few minutes with Product Analytics by Dotidot.

Hana Kobzová is a freelance PPC specialist and the founder of PPC News Feed. Named among the TOP 100 Most Influential PPC Experts 2026, she is also a Google Ads Product Expert and a Microsoft Advertising Certified Professional. Hana delivers clear updates and actionable insights that help marketers save time and work smarter.