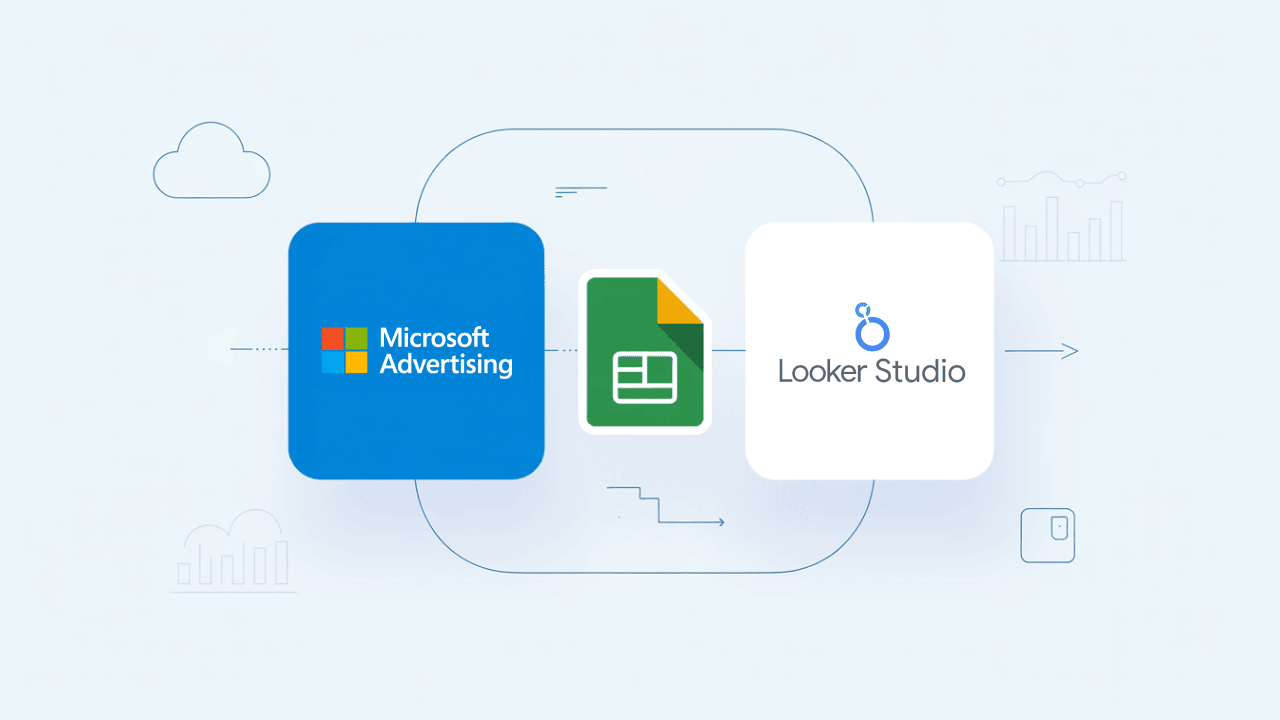
In this guide, I share with you a free method to automatically send Microsoft Ads data to Google Sheets, which can then be connected directly to Looker Studio using the native Google Sheets connector.
Automate Microsoft Ads Reporting Without Paid Tools
Creating reports and tracking performance is an essential part of a PPC marketer’s job, but doing this with Microsoft Ads (Bing Ads) in Looker Studio isn’t straightforward due to the lack of a native connector, which often leaves advertisers relying on paid tools or manual workarounds.
The method I’ll walk you through is 100% free and requires only a Google Sheet, Google Apps Script and a Microsoft Ads script. There are no servers, no API keys, no paid tools, and no ongoing costs.
By the end of this tutorial, you’ll have a fully automated flow that pulls your Microsoft Ads campaign metrics into Google Sheets on a daily schedule, ready to be connected to Looker Studio for seamless reporting and data visualization.
Free vs Paid Microsoft Advertising Connector
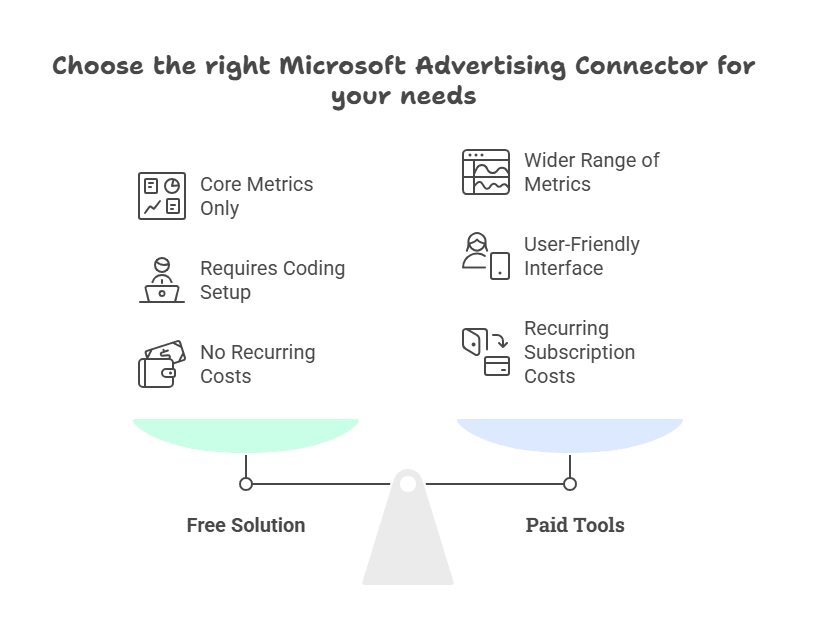
When deciding between a free, custom-built Microsoft Ads connector like the one in this guide and a paid tool, there are a few key differences to consider.
Key Differences
Available Metrics and Segmentation
Free solution: Reports only on core PPC metrics (clicks, impressions, cost, conversions, revenue, and calculated values like CPC or CTR).
Paid tools: Offer a much wider range of metrics, dimensions, and segmentation options, including audience data, device breakdowns, keyword and ad-level stats, and more.
Ease of Use
Free solution: Requires a one-time setup and slight code modifications in Google Apps Script and Microsoft Ads scripts. Once configured, it runs automatically on a set schedule.
Paid tools: No coding required. They offer polished, user-friendly interfaces with prebuilt connectors and ready-made report templates.
Cost
Free solution: Completely free to run, with no recurring costs.
Paid tools: Require a recurring subscription, which can range from tens to hundreds of dollars per month.
Which One to Choose?
If your primary goal is simply to pull Microsoft Ads campaign metrics into Google Sheets and feed them into Looker Studio, the free method in this guide is lightweight, cost-free, and gets the job done.
But if you are managing multiple clients, need more advanced metrics or want to aggregate data from different platforms, a paid platform is worth considering.
AgencyAnalytics stands out among paid solutions. Here are some key features you will not get with the free method:
- Automated Cross Channel Reporting
Connect all your marketing platforms and automatically pull campaign data into one unified dashboard. - 80+ Marketing Integrations
Connect data from Google Ads, Microsoft Advertising, Google Analytics 4, Search Console, Bing Webmaster Tools, Meta, LinkedIn, X, TikTok, SEO tools, and more. - White Label Dashboards
Fully customize dashboards with your own branding, domain, and color scheme so reports look like they come directly from your agency. - Drag and Drop Report Builder
Create tailored reports using a simple editor with widgets for metrics, graphs, and annotations. - Goals, Alerts, and Custom Metrics
Track campaign progress and spending against targets, highlight campaign milestones, set up instant metric alerts, and create custom KPIs tailored to client needs. - Anomaly Detection
Automatically flag unusual spikes and drops in performance. - Trend Forecasting
Predict future outcomes based on historical data and see projections with the predictive marketing tool.
Save hours every week by turning messy data into sleek automated, white-label reports & dashboards. Plug into 80+ native integrations, let AI-powered insights reveal hidden trends, and give clients a front-row seat with secure staff & client access control. It’s reporting that doesn’t just inform. It impresses.

Prerequisites for Building Your Free Microsoft Ads Connector
Before we dive into the setup, there are a few things you’ll need in place. These are the core components that will work together to automate your reporting from Microsoft Ads into Google Sheets (and eventually Looker Studio).
- An empty Google Sheet – This will serve as the destination for your PPC data. You don’t need to add headers; the script will create them automatically the first time it runs.
- A Google Apps Script web app – This script will accept JSON data via POST requests and append new rows to your Google Sheet.
- A Microsoft Advertising script – This script will pull campaign-level metrics from your Microsoft Ads account on a daily schedule, with an option to backfill historical data if needed.
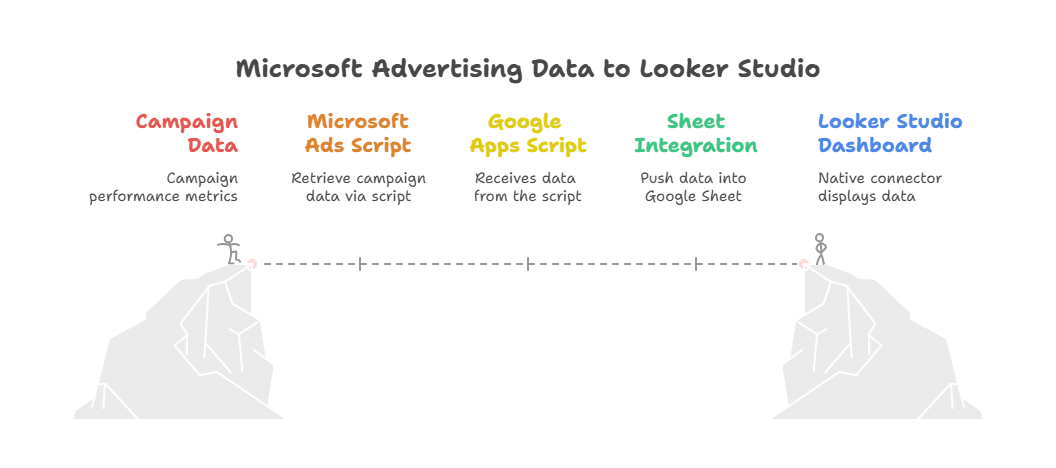
Together, these components create a simple but powerful pipeline. The Microsoft Ads script gathers your campaign metrics, sends them in JSON format to the Google Apps Script web app, and the web app appends the data to your Google Sheet, ready for analysis or connection to Looker Studio.
Step-by-Step Guide to Connecting Microsoft Ads to Looker Studio
Step 1. Create the Destination Google Sheet
- Create a new Google Sheet
- Name it for example Client Name – Microsoft Ads Daily Report.
- Change the sheet name to “Data”.
- Leave it empty. The script will create the header row on the first write.
Step 2. Create the Apps Script Web App
Next, we’ll set up a Google Apps Script that receives data from Microsoft Ads and writes it directly into your Google Sheet. This script appends new rows to a sheet named Data within the spreadsheet you created in Step 1 and sends back a simple JSON response confirming the insert.
- In your Google Sheet, go to Extensions > Apps Script.
- Delete the default function and replace it with the following code:
/**
 * Script name: Microsoft Ads to Google Sheets
 * Description: Sends Microsoft Ads PPC metrics to Google Sheets daily
 * Author: Hana Kobzová (PPCNewsFeed.com)
 */

const SHEET_NAME = "Data";

function doPost(e) {
  try {
    if (!e || !e.postData || !e.postData.contents) {
      return _json({ ok: false, error: "No body" });
    }

    const payload = JSON.parse(e.postData.contents);
    const rows = Array.isArray(payload) ? payload : (payload.rows || [payload]);

    const ss = SpreadsheetApp.getActive();
    const sheet = ss.getSheetByName(SHEET_NAME) || ss.insertSheet(SHEET_NAME);

    // Header
    if (sheet.getLastRow() === 0) {
      sheet.appendRow([
        "Timestamp",
        "Account name",
        "Account ID",
        "Date",
        "Campaign",
        "Clicks",
        "Impressions",
        "Cost",
        "Conversions",
        "Revenue",
        "Average CPC"
      ]);
    }

    const out = rows.map(r => {
      const clicks = toNum(r.clicks);
      const cost = toNum(r.cost);
      const avgCpc = clicks > 0 ? cost / clicks : 0; // recompute to be safe
      return [
        new Date(),
        r.accountName || "",
        r.accountId || "",
        r.date || "",
        r.campaign || "",
        clicks,
        toNum(r.impressions),
        cost,
        toNum(r.conversions),
        toNum(r.revenue),
        Number(avgCpc.toFixed(4))
      ];
    });

    if (out.length) {
      sheet.getRange(sheet.getLastRow() + 1, 1, out.length, out[0].length).setValues(out);
    }

    return _json({ ok: true, inserted: out.length });
  } catch (err) {
    return _json({ ok: false, error: String(err) });
  }
}

function toNum(x) { return x == null || x === "" ? 0 : Number(x); }

function _json(obj) {
  return ContentService.createTextOutput(JSON.stringify(obj)).setMimeType(ContentService.MimeType.JSON);
}- Once the code is in place, click Deploy > New deployment.
- Under Select type, choose Web app.

- Set Execute as to Me.
- For Who has access, choose Anyone.

- Click Deploy
- Authorize access
- Copy the Web App URL provided. Save it for later.

Tips:
- If you update this code later, open Deploy > Manage deployments > Edit and redeploy, then make sure you are using the current
/execURL. - Test the endpoint by opening the
/execURL in an incognito window. You should seeokfromdoGet.
Step 3. Add the Microsoft Advertising script
This script posts one row per campaign for a chosen date. It also supports backfill. It skips campaigns with 0 impressions.
- In Microsoft Advertising, go to the individual account > Tools > Bulk actions > Scripts, then click Create script.
- Paste in the code provided below.

- Update
WEBHOOK_URLwith your/execURL from the Apps Script deployment from Step 2. - Decide how you want to run it:
- One-time backfill: Set specific
START_DATEandEND_DATEvalues (format:yyyy-MM-dd) and run the script once manually. - Daily automation: Set both
START_DATEandEND_DATEto"YESTERDAY". Then schedule the script to run once per day. Pick a time at least a couple of hours after midnight (e.g., 06:00 in the account’s timezone) to make sure the data is fully processed and accurate.
- One-time backfill: Set specific
/**
* Script name: Microsoft Ads to Google Sheets
* Description: Sends Microsoft Ads PPC metrics to Google Sheets daily
* Author: Hana Kobzová (PPCNewsFeed.com)
*/
function main() {
var WEBHOOK_URL = "https://script.google.com/macros/s/your-web-app-id/exec";
// Date range settings
var START_DATE = "YESTERDAY"; // yyyy-MM-dd or "YESTERDAY"
var END_DATE = "YESTERDAY"; // yyyy-MM-dd or "YESTERDAY"
var SKIP_ZERO_IMPRESSIONS = true;
var POST_CHUNK_SIZE = 500;
var acctName = AdsApp.currentAccount().getName();
var acctId = AdsApp.currentAccount().getCustomerId();
// Daily mode
if (START_DATE === "YESTERDAY" && END_DATE === "YESTERDAY") {
var d = yesterday_();
sendDataForDate_(WEBHOOK_URL, d, acctName, acctId, SKIP_ZERO_IMPRESSIONS, POST_CHUNK_SIZE);
return;
}
// Backfill mode
var start = START_DATE === "YESTERDAY" ? yesterday_() : parseYmd(START_DATE);
var end = END_DATE === "YESTERDAY" ? yesterday_() : parseYmd(END_DATE);
if (!start || !end || start.getTime() > end.getTime()) {
Logger.log("Invalid date range");
return;
}
var day = new Date(start.getTime());
while (day.getTime() <= end.getTime()) {
sendDataForDate_(WEBHOOK_URL, day, acctName, acctId, SKIP_ZERO_IMPRESSIONS, POST_CHUNK_SIZE);
day.setDate(day.getDate() + 1);
}
}
/** Collects campaign data for a single date and posts it **/
function sendDataForDate_(url, dayDate, acctName, acctId, skipZero, chunkSize) {
var ymd = toYmd(dayDate); // for payload
var dateArg = toSelectorDate_(dayDate); // for forDateRange
var rows = [];
var it = AdsApp.campaigns()
.forDateRange(dateArg, dateArg) // expects {year, month, day}
.get();
while (it.hasNext()) {
var c = it.next();
var s = c.getStats();
var impressions = s.getImpressions() || 0;
if (skipZero && impressions === 0) continue;
var clicks = s.getClicks() || 0;
var cost = s.getCost() || 0;
var conv = s.getConversions() || 0;
var revenue = s.getRevenue ? (s.getRevenue() || 0) : 0;
var avgCpc = s.getAverageCpc ? (s.getAverageCpc() || 0) : (clicks > 0 ? cost / clicks : 0);
rows.push({
accountName: acctName,
accountId: acctId,
date: ymd,
campaign: c.getName(),
clicks: clicks,
impressions: impressions,
cost: +cost.toFixed(2),
conversions: conv,
revenue: +revenue.toFixed(2),
averageCpc: +avgCpc.toFixed(4)
});
}
if (rows.length > 0) {
postInChunks_(url, rows, chunkSize);
Logger.log("Posted " + rows.length + " rows for " + ymd);
} else {
Logger.log("No campaigns with impressions for " + ymd);
}
}
/** Helpers **/
function yesterday_() {
var d = new Date();
d.setHours(0,0,0,0);
d.setDate(d.getDate() - 1);
return d;
}
function parseYmd(s) {
var parts = s.split("-");
if (parts.length !== 3) return null;
var y = parseInt(parts[0], 10);
var m = parseInt(parts[1], 10);
var d = parseInt(parts[2], 10);
if (!y || !m || !d) return null;
return new Date(y, m - 1, d);
}
function toYmd(dt) {
var y = dt.getFullYear();
var m = dt.getMonth() + 1; if (m < 10) m = "0" + m;
var d = dt.getDate(); if (d < 10) d = "0" + d;
return y + "-" + m + "-" + d;
}
function toSelectorDate_(dt) {
return {
year: dt.getFullYear(),
month: dt.getMonth() + 1,
day: dt.getDate()
};
}
function postInChunks_(url, rows, size) {
var i = 0;
while (i < rows.length) {
var chunk = rows.slice(i, i + size);
var payload = { rows: chunk };
var options = {
method: "post",
contentType: "application/json",
payload: JSON.stringify(payload),
muteHttpExceptions: true
};
var res = UrlFetchApp.fetch(url, options);
Logger.log("HTTP " + res.getResponseCode() + " " + res.getContentText());
i += size;
}
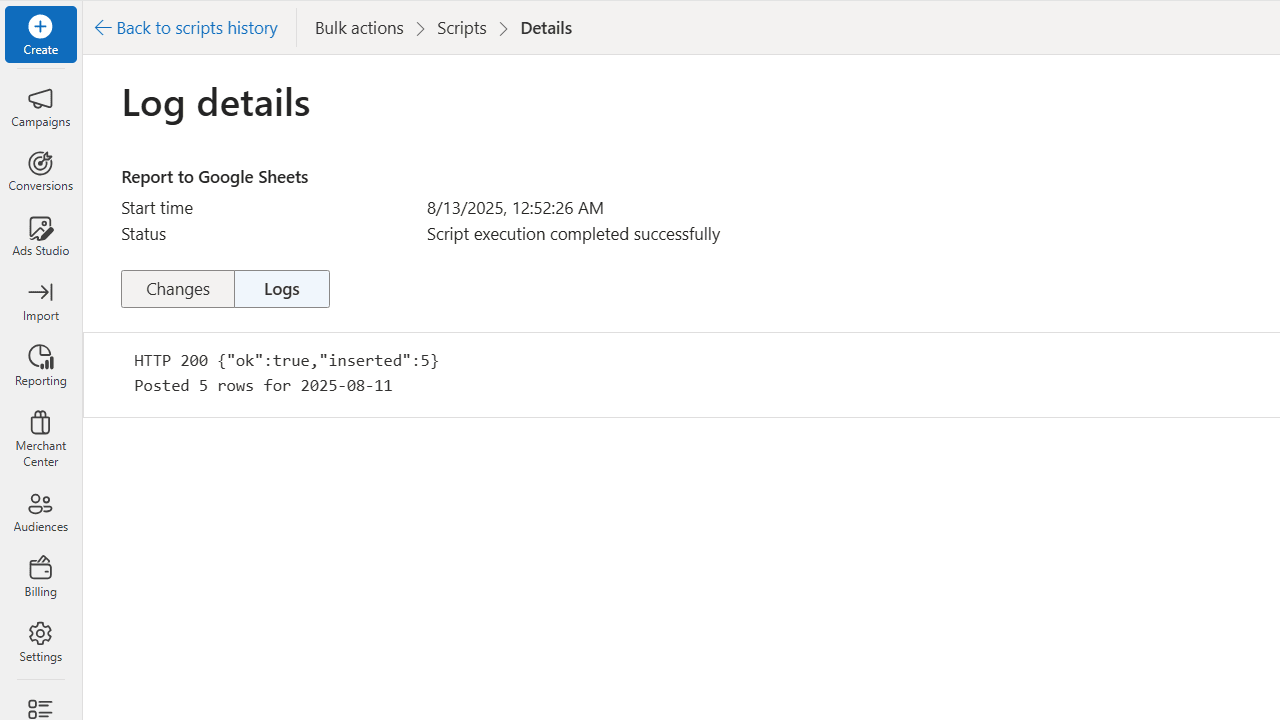
}Step 4. Test the Flow End to End
- In Microsoft Ads, open Tools > Scripts, create a new script, and paste the code as described in Step 3.
- Click Run to execute the script. Avoid relying on Preview as it doesn’t always send the POST request.
- Open the Google Sheet. You should see new rows under the
Datatab. - In the Microsoft Ads script logs, you should see
HTTP 200 {"ok":true, "inserted":N}.
Step 5. Connect the Sheet to Looker Studio
With your Microsoft Ads data now flowing into Google Sheets, the final step is connecting that sheet to Looker Studio so you can start building your PPC report for Microsoft Advertising.
- Open Looker Studio and click Create > Report.
- When prompted to choose a data source, select Google Sheets.
- Locate the sheet you set up earlier (e.g., Client Name – Microsoft Ads Daily Report), and select the Data tab.
- Click Connect, then Add to Report.
Final Thoughts
By combining a simple Apps Script with a Microsoft Ads script, you’ve built your own connector that automatically delivers fresh campaign data to Google Sheets and Looker Studio, without paying for third-party tools.
This solution is lightweight, cost-free, and perfect if you only need core performance metrics like clicks, impressions, cost, conversions, and revenue.
If your reporting needs are more complex, a platform like AgencyAnalytics can be a strong next step.
Save hours every week by turning messy data into sleek automated, white-label reports & dashboards. Plug into 80+ native integrations, let AI-powered insights reveal hidden trends, and give clients a front-row seat with secure staff & client access control. It’s reporting that doesn’t just inform. It impresses.